Safe Work Australia’s Key Work Health and Safety Statistics is a snapshot of WHS in Australia, analysing national safety data on work-related fatalities, injuries, and diseases.
This report gives safety leaders and executives a clear national picture of where harm occurs and what is driving it, so you can use this data to inform strategic decisions about controls, culture and work design that will have the biggest impact on keeping people safe.
We have highlighted some key areas of the report, but we encourage leaders and managers to download the full report at the end of this article and review the data specific to your industry, job roles and risk profile of your organisation.
This 2025 report is based on the finalised and validated data for the previous year.
Work-related fatalities and injuries
In 2024, 188 workers lost their lives due to work-related injuries – a slight decrease from the five-year average of 191. The fatality rate fell to 1.3 deaths per 100,000 workers, down 24% since 2014, but remains a serious concern.

Worker fatalities by state/territory, 2024
Queensland recorded the highest number of worker deaths (53), followed by New South Wales (48). The Northern Territory had the highest fatality rate at 2.8 per 100,000 workers, while Western Australia recorded 1.9. Men accounted for 96% of fatalities.
Fatalities by age and mechanism
Workers aged 65 and over faced the highest fatality rate (4.3 per 100,000), and vehicle incidents remained the leading cause, responsible for 42% of worker deaths. Falls from height made up 13% of fatalities.

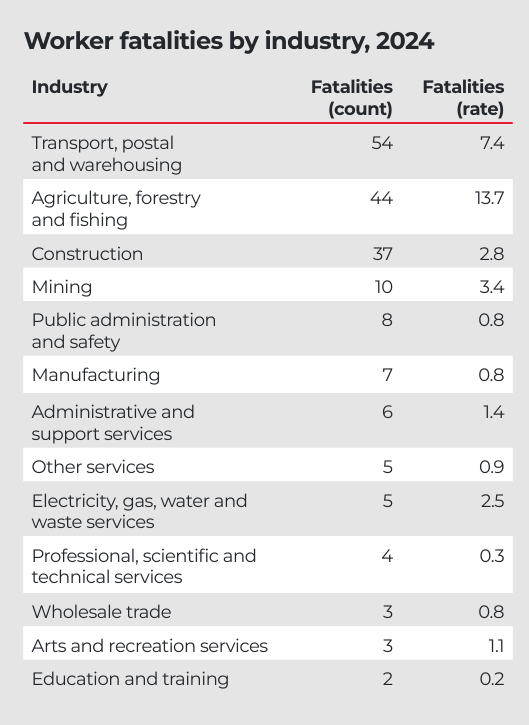
Fatalities by industry
Work-related harm continues to cluster in a handful of industries. In 2024, 80% of traumatic fatalities and 61% of serious compensation claims occurred in just six industries:
-
Transport, postal and warehousing
-
Agriculture, forestry and fishing
-
Construction
-
Public administration and safety
-
Manufacturing
-
Health care and social assistance
Three industries alone accounted for 72% of all worker fatalities.